
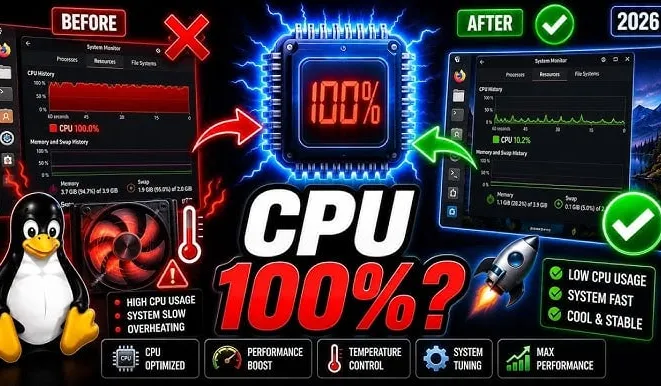
Fix High CPU Usage With Resource Monitor 2026: A Practical Guide
How to Troubleshoot and Fix High CPU Usage Using Windows Resource Monitor
Resource Monitor provides a detailed user interface to help you monitor your system's resource behavior. Once you get familiar with this app, it becomes an indispensable tool when troubleshooting and fixing high CPU usage issues. So let us take a look at some use cases for the Resource Monitor app on Windows.
What Does the Resource Monitor Utility Do on Windows?
You may face the problem of your Windows computer slowing down due to high CPU usage. In general, CPU usage increases either because of background processes or heavy apps currently running on your device. Resource Monitor can help you identify the apps or services consuming CPU cycles. It gives you instant information about the services and processes running on your device, so you can quickly discover high CPU issues and take the necessary action to solve them thanks to the graphs and numerical data the app provides.
What Can You Monitor With Resource Monitor?
The Resource Monitor dashboard gives an overview of the current system-wide resource usage across four main areas. The CPU section depicts overall CPU usage over time and a list of processes with their CPU impact. The Memory section lets you view details about your system's memory, such as total physical memory and the processes consuming memory. The Disk activity tab monitors current disk operations divided by read/write operations and includes a graph showing response-time distribution. The Network activity tab lets you monitor and track bytes sent/received, plus real-time network-usage graphs. Together, these categories give you a complete view of every hardware resource's consumption across each process and service.
How Do You Troubleshoot High CPU Usage With Resource Monitor?
If you have a slow, unresponsive computer, the first step is to open Resource Monitor and check the "CPU" tab. Here you will find two types of sections: the overall CPU usage graph and the list of processes using the CPU. The graph can be understood, but the main use is the process list with all its details. The CPU history graphs at the top show the total CPU usage over time, divided by category. If you see a spike in blue, this indicates a sudden increase in CPU usage, which may be due to a specific process or app consuming a large part of the total CPU resources. On the left side, click the CPU column header to sort the processes in order. Note that the numbers are only the percentage the process is consuming, so a higher number means it is consuming more CPU power than others.
How Do You Diagnose Slow Internet With Resource Monitor?
Resource Monitor also makes it easy to determine whether network connection issues, like slow internet or high latency, are caused by an app consuming bandwidth. Simply click Total (B/sec) to sort the processes by network usage rate and identify any heavy bandwidth consumer. Certainly, programs like an active web browser or a game you are currently running will consume more data. But besides these programs, if any of the processes show a high number, that is a warning sign for you.
How Do You Check Disk Activity With Resource Monitor?
Sometimes the cause of slow system performance may be poor disk activity, especially if read/write operations are excessive in the queue. This is where the "Disk" tab provides valuable insight. The disk usage graphs on the right side show read and write operations in real time. But more importantly, the process disk-activity list reveals the specific apps or services doing all this writing and reading. Click the Total (B/sec) column to sort by disk usage rate and see the most concerning processes at the top. The rest of the columns show separate read and write operations for each process.
How Do You Find Memory-Consuming Processes With Resource Monitor?
Available memory is as important to performance as CPU and disk resources. A memory leak can weaken even the most powerful systems. The best part is that Resource Monitor gives you enough details to troubleshoot and fix system memory errors. In the "Memory" tab, there are multiple metrics to watch. The most important are Free memory, In Use memory, and Hard Faults/sec. The available and used memory counts show the amount of memory currently unused and the amount used by the system, respectively. If you see a big rise in the In Use memory count, make sure to close some unnecessary running programs. On the other hand, if the Hard Faults/sec values are higher (click its name to sort), this indicates your system is under memory pressure, since a higher value means your system relies on virtual memory to compensate for a lack of actual physical RAM.
What Are the Tips to Fix High Memory Usage?
To find the processes consuming the most memory, click the Working Set (Memory) column header to sort by current memory usage, then identify any outliers consuming your available RAM. Using the available memory information and the following tips, you can easily detect and fix excessive memory usage errors: if a process is consuming memory heavily, try closing that app (via Task Manager) and restarting your computer; if possible, add RAM to your device, especially if the available memory frequently maxes out, since the apps you use may need more RAM than is currently installed; and learn how to disable startup programs on Windows and try to disable programs you will not need when starting your device. By understanding the basics of using Resource Monitor, you can turn a slow, unresponsive computer into pinpointing the processes or services consuming your system's resources. We strongly recommend checking each tab and using the sorting capabilities to check the offenders by CPU, network, disk, and memory usage. Once you identify the suspects, you can stop the problematic processes/tasks.
FAQs
CONTACT US
Download the app


CONTACT US


Payment Methods










Shipping with

©2026 MobiTech Integrated Solutions. . All Rights Reserved
©2026 MobiTech Integrated Solutions. . All Rights Reserved